The Center for Exhibition Industry Research (CEIR) released the 2018 CEIR Index Report, 12 April, revealing that the growth of the B2B exhibition industry accelerated along with the macro economy in 2017.
The CEIR Index analyses the 2017 exhibition industry and provides an economic and exhibition industry outlook for the next three years. As an objective measure of the annual performance of the exhibition industry, the CEIR Index measures year-over-year changes in four key metrics to determine overall performance: net square feet (NSF) of exhibit space sold; professional attendance; number of exhibiting companies and gross revenue.
The CEIR Index provides data on exhibition industry performance across 14 key industry sectors:
- Business Services (BZ)
- Consumer Goods and Services (CG)
- Discretionary Consumer Goods and Services (CS)
- Education (ED)
- Food (FD)
- Financial, Legal and Real Estate (FN)
- Government (GV)
- Building, Construction, Home and Repair (HM)
- Industrial/Heavy Machinery and Finished Business Inputs (ID)
- Communications and Information Technology (IT)
- Medical and Health Care (MD)
- Raw Materials and Science (RM)
- Sporting Goods, Travel and Entertainment (ST)
- Transportation (TX)
US economic growth proved resilient again in 2017. GDP accelerated to 2.3 per cent, a significant improvement over the 1.53 per cent expansion registered for 2016 and an eighth consecutive year of moderate growth.
CEIR expects that GDP growth in the next few years will be propelled by a high rate of growth in personal consumption expenditures and improving private investment spending, in part due to recent tax cuts.
Strengthening, but moderate government expenditures, will provide an additional boost. According to CEIR’s current projection, growth will rise to around 2.9 per cent in 2018 before decelerating slightly to 2.7 per cent in 2019 and 2.5 per cent in 2020 (see Figure 1).
Figure 1: Annual real GDP growth
All four metrics rose in 2017, with real revenues leading at 2.9 per cent above 2016. Attendees and NSF rose 2.1 per cent and 2.0 per cent, respectively, whereas exhibitors gained 1.1 per cent.
“Optimism in the business environment and robust economic and job growth should continue to drive exhibitions,” noted CEIR economist Allen Shaw, Ph.D., chief economist for Global Economic Consulting Associates, Inc.
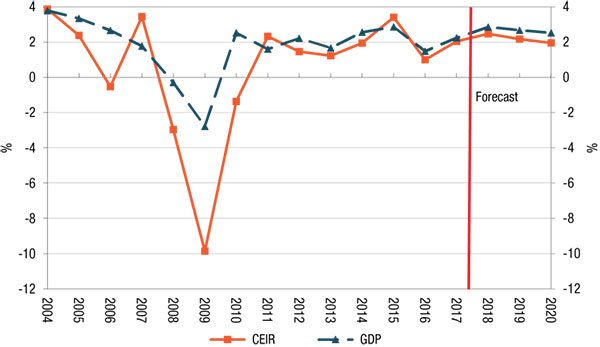
“The exhibition industry is expected to finally enter into an expansion phase in 2018 with the Total Index surpassing its previous peak,” said Shaw.
Figure 2: Growth in the CEIR total index for the overall exhibition industry vs. GDP Growth
The CEIR Total Index, a measure of overall exhibition industry performance, increased by a moderate 2.0 per cent, 1.0 percent point higher than in 2016.
Show organisers can use the latest data in tandem with the CEIR Index Event Performance Analyser (IEPA) to measure their event’s performance. Created with support from the Society of Independent Show Organisers (SISO), CEIR’s IEPA is designed to provide organisers a benchmark for how their exhibition is performing against the CEIR Index metrics. The IEPA also compares the exhibition versus the overall performance of the industry sector and the exhibition industry overall.
A forecast update of the CEIR Index will be presented at Predict: CEIR’s Annual Exhibition Industry Conference at the MGM National Harbor in Oxon Hill, Md, 13-14 September.
“The combination of the CEIR Index Report, CEIR Census and Event Performance Analyser Tool is a powerhouse of resources to use in strategizing for the near future,” said CEIR CEO Cathy Breden, CMP, CAE.
“All this data is real-time information that, when factored into what the expert economists and futurists are telling us, allows for industry executives to feel confident in how they plan ahead,” added Breden.
For more information on CEIR, click here. www.ceir.org.


